Data visualization is crucial in making the data more accessible and understandable. Most organizations want to thrive on data. Equipped with brilliant data visualization tools to combine all the data, they often overlook the critical element, humanizing the data points.
The data must tell a compelling story to guide decisions for strategic initiatives within the organization. To speed up this process, powerful visualization and interactive design are imperative.
But building better data narratives requires an understanding of data visualization’s role in a successful data humanizing process and the extent of benefits it offers to a business.

What is humanizing data?
Humanizing data is making raw data and analytics findings more relatable and easy to understand for people, regardless of their technical expertise. It is a process of working with data for humans using it by providing context, real-world examples, and visual aids. It gives people within the organization a magic wand to uncover data points and insights without any involvement of the data experts.
More significantly, they will be able to identify subtle nuances in how they use the data. Data visualization can easily outline enhanced business outcomes and help them digest the correct information at the right time to achieve their goals faster.

How can visualization reinforce data points?
Adding a human touch to your dashboard is crucial to get the most out of raw data. Storytelling and data visualization is the most effective method to humanize data. Everyone within the organization can’t handle raw data. It requires streamlined data analysis to showcase a clear picture of analytics results instantly.
As more companies increasingly utilize machine learning to gather a massive amount of data that can be difficult to comprehend and explain, visualization is the best way to study the data. Embracing data visualization techniques, tools, and intricate methods like infographics, heat maps, time series chats, treemaps, animations, interactive design, and illustrations can reinforce the data points. This allows us to envision data on a more human level, engage the organization’s decision-makers and reap benefits from the information it offers.
Moreover, it is essential to have people and processes in place to control the data quality, metadata, and data sources to fuel your visuals with accurate information.
Benefits of visualizing data
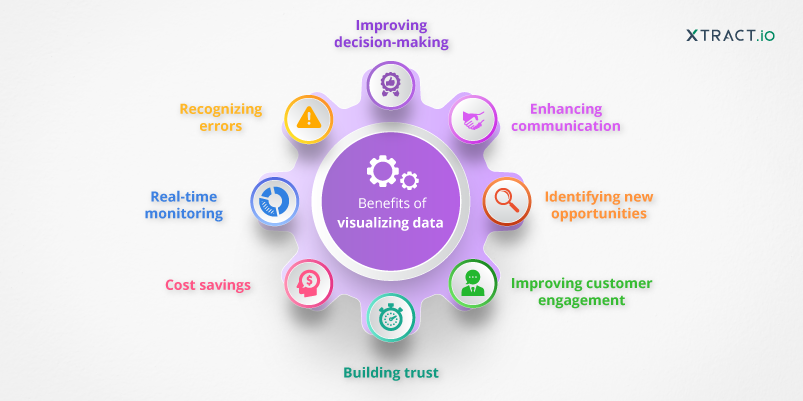
Powerful data visualization can help your business connect with a broader audience in multiple ways, including
- Improving decision-making: Business leaders can easily interpret and utilize information to make more informed decisions by making data more relatable and understandable.
- Enhancing communication: Visualization can help to make data more accessible and engaging for a broader range of stakeholders, improving communication and collaboration across the organization.
- Identifying new opportunities: Businesses can quickly identify recent trends, patterns, and opportunities they may have missed.
- Improving customer engagement: By providing more convincing and understandable data to stakeholders, businesses can improve customer engagement and understanding of their products or services.
- Building trust: Data visualization helps businesses to be more transparent by providing context and real-world examples. It builds trust and credibility with customers, partners, and other stakeholders.
- Cost savings: Companies can leverage actionable data to streamline decision-making and improve efficiency, leading to cost savings.
- Real-time monitoring: Data access in real-time allows organizations to gain immediate insight into processes and improve business efficiency.
- Recognizing errors: With Effective data visualization and humanized approach, it becomes easier to identify the mistakes in the business process and immediately adopt best practices.
Is it the best idea to invest in data visualization tools?
Data visualization ensures your data are accessible and inclusive. To see your data in action, It is essential to set up an effective data visualization tool for your business. Particularly if crunching the data and maintaining quality are your biggest challenges.
Data visualization tools can help you analyze data in real time and bring your data to life. So, you can construct a meaningful, easy-to-digest narrative and navigate through the analytics results in a concise and clear visual format.
These tools can improve accuracy and deliver insights for common knowledge. Adopting a data visualization solution for your company can be a big step. However, ensuring the solution meets your data needs and goals is essential.
Xtract.io enables digital transformation through practical data visualization strategies that connect all people across the organization. We help formulate and execute data processing strategies to help you achieve your bespoke business outcomes so that you can get the best out of your data visualization initiatives.
Reach out to our data experts to transform your business into a more data-driven organization with a profound human approach, which can help you acquire enormous growth opportunities faster.