Businesses can easily list the major players, understand the basic demand, and get a rough sense of how things work with existing internal data. However, this surface clarity can be misleading when businesses rely only on observable data without deeper spatial analysis. In reality, success is rarely obvious at the outset. It emerges from a dynamic interplay of how customers choose locations, how competitors respond across regions, and how countless individual decisions accumulate over time to shape the market landscape.
Many firms that plan only on what is observable are missing what matters most. That’s why polygon data becomes vital in present-day spatial analysis and GIS mapping to understand the market and competitors.
Polygon data enables polygon mapping, a core technique in GIS mapping for representing real-world areas on a map using polygons. By mapping polygons, competitors’ reach, overserved markets, and unmet demands are clearly identified, making intuition and guesswork visible, measurable, and actionable. With the right polygons in place, a map created through GIS mapping ceases to be a picture of where things are and becomes a strategy for where your business needs to go next.
Understanding polygon data in spatial analysis and GIS mapping
So what is polygon data? At a fundamental level, polygon data represents geographic areas using closed shapes on a map. Unlike point data (which marks a single latitude and longitude), polygons define boundaries that enable deeper spatial analysis of markets and territories. These boundaries can represent trade areas, service zones, administrative regions, delivery territories, or competitive influence.
In polygon analysis, each shape contains spatial attributes such as population, income, demand density, or sales performance. This allows businesses to measure not just where something is located, but how much opportunity or competition exists within a defined area.
Common business use cases for polygon data in GIS mapping include:
- Defining store catchment areas
- Mapping competitor service regions
- Analyzing market coverage gaps
- Supporting GIS-based territory planning
When applied correctly, polygon data transforms static maps into analytical tools for decision-making. Let’s see how polygon data helps with spatial analysis for competitor and market analysis.
How to use polygon data for competitor spaces and market coverage
To explain how polygon data can be used in practical applications, let’s take a medium-scale retail business as an example. This retail outlet wishes to have a more substantial presence in a large urban city. Here’s a practical, step-by-step approach they took to use polygon data effectively.
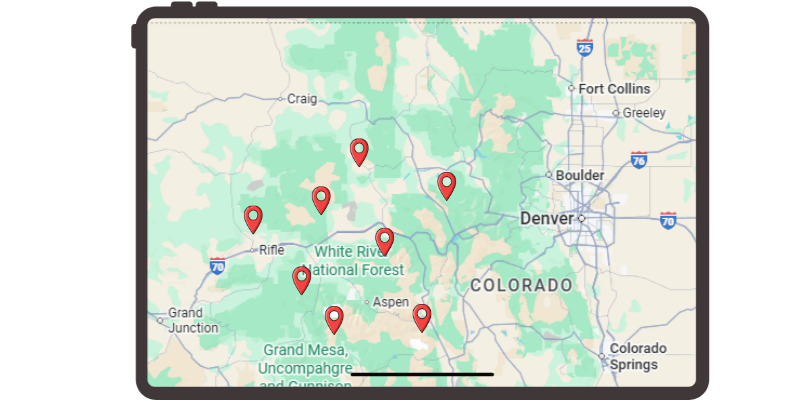
Step 1: Gather Location Information
First, the company identifies the precise location data of its current stores and service centers in the city. These internal locations are pulled from its operations and sales systems to ensure consistency.
Next, their analytics team collects competitor store locations using public business listings and third-party POI data providers.
To better understand customer demand, the company also includes POI attributes for each location, like customer addresses, transaction histories, and past sales data for each POI (Point of Interest). This combined dataset forms the foundation for all subsequent polygon analysis, making data accuracy critical at this stage.
All store, competitor, and customer POIs, together with their associated attributes, are then loaded into a centralized GIS mapping and spatial analytics platform, where location geometry and attribute data are managed together for visualization and downstream analysis.
Tip: Validate all POI coordinates and attributes early to avoid distorted spatial results. A store geocoded to the wrong street block could incorrectly appear outside its true service area, understating its actual customer reach.
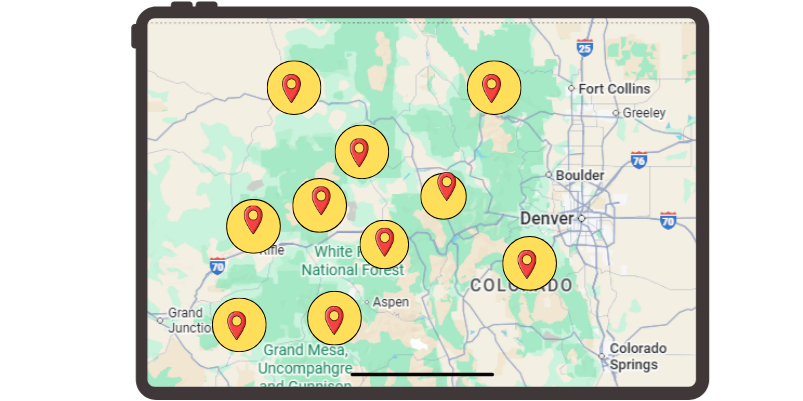
Step 2: Define service or trade areas
Once all locations are mapped, the company defines realistic trade areas around each store. Instead of relying solely on straight-line distances, it uses drive-time models to represent how far customers are willing to travel.
In dense urban neighborhoods, the company applies smaller walk-time polygons, while suburban stores use larger drive-time zones.
These polygons convert individual store POIs into service territories that reflect actual customer behavior rather than assumed reach, forming the foundation for accurate territory planning.
Tip: Always use travel-time–based polygons rather than straight-line distance. A 10-minute drive polygon may reach farther along highways than local roads, capturing customers that a simple 5-km radius would miss.
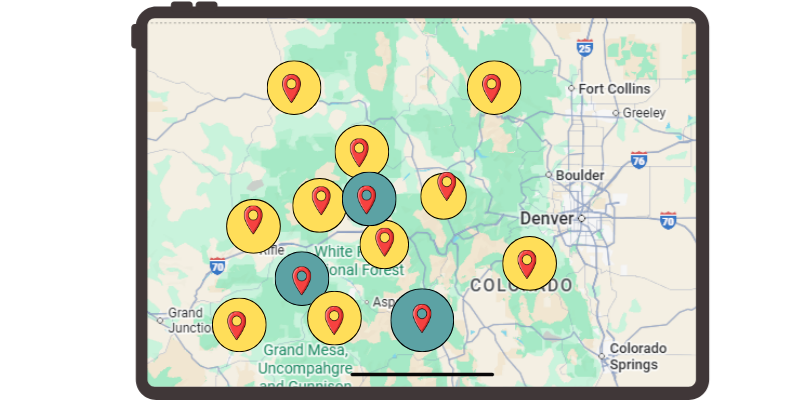
Step 3: Layer competitor polygons
The company then goes on to build similar polygons for their main competitors, based on their service areas, and projects them on the same GIS Mapping platform.
This layered view immediately shows where multiple competitors are competing for the same customers and where one brand dominates coverage.
By visualizing competitor territories side by side, the company gains a clearer understanding of competitive pressure across different parts of the city.
Tip: Use consistent polygon logic across competitors to ensure fair comparisons. If your stores use 15-minute drive times but competitors use 20 minutes, competitor coverage may appear stronger than it truly is.
Step 4: Analyze market gaps and overlaps
With all polygons in place, analysts begin spatial analysis by examining overlaps and gaps. In some districts, the map shows heavy overlap between several competitors, indicating market saturation.
In other neighborhoods, customer demand exists, but few competitor polygons appear, signaling potential market gaps.
Through this, the company can measure these patterns numerically, enabling it to compare territories objectively rather than based on assumptions.
Tip: Prioritize demand-backed gaps instead of empty geographic space. A neighborhood with few store polygons but high transaction density signals a stronger opportunity than an empty industrial zone.
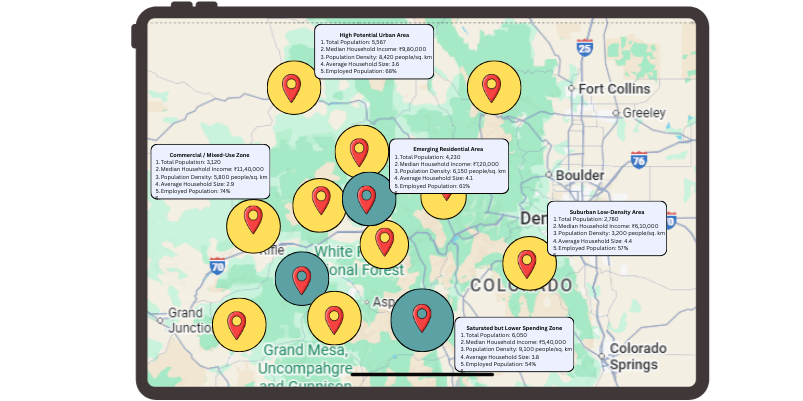
Step 5: Combine with demographic or sales data
For the verification of these results, the company adds demographic and sales data to the polygon information. Regions of high population density and good earnings, along with consistent purchasing patterns, are termed high-potential areas.
In contrast, some areas are deprioritized due to lower purchasing power, as indicated by demographic analysis. This step is crucial to ensure that market expansion is based on profitability, not just geographical presence.
Tip: Always evaluate territory quality using both people and spending power. Two areas may have similar population size, but the one with a higher average transaction value becomes the preferred expansion target.
Step 6: Turn insights into decisions
With insights derived from spatial analysis, the company can pinpoint specific neighborhoods for new store openings and reallocate marketing spend away from saturated areas.
Delivery zones are then fine-tuned to reduce zone crossovers and enhance efficiency. Sales territories are rebalanced using data-driven territory planning to ensure a proper distribution of demand. Consequently, the organization can venture into new markets using clear spatial information rather than estimates.
Tip: Continuously measure results after implementation to validate spatial assumptions. After redrawing delivery zones, the company monitors delivery time and order volume to confirm efficiency gains.
The takeaway
The next time you gaze at that map of your city, don’t see roads and points of interest. Analyze where your customers are going, see beyond the competition, and understand where you can grow through intelligent spatial analysis. And most importantly, see the story your business can write in those spaces.
If you want to leverage the data you can obtain from polygons for making a more intelligent competitor analysis and market expansion strategy, Xtract.io can assist you. Please feel free to contact us for access to accurate and usable polygon data that translates maps into actionable insights.